
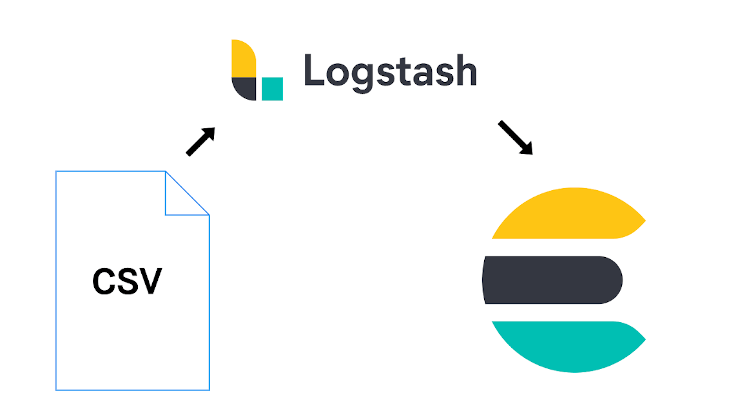
Frequently when we want to test out a new feature in Elasticsearch we need some data to play with. Unfortunately, Kibana and Elasticsearch don’t provide an easy, out-of-the-box way to simply import a CSV.
That’s why there is Logstash in the known ELK stack. Its job is to watch to a data source, process incoming data, and output it into specified sources. Once started, it usually stays on and watches for any changes in the data source.
Here, I’ll guide you step by step on how to import a sample CSV into Elasticsearch 7.x using Logstash 7.x. By the end, you should be able to tweak the provided example to fit your own needs. There will be plenty of links to the official documentation, but that’s just for convenience.
Sample CSV
For this blog, I’ve imported the usual Hackernews stories from BigQuery Public Data Sets. The CSV is available here.
The schema looks like this:
| Field name | Type | Description |
|---|---|---|
| id | INTEGER | Unique story ID |
| by | STRING | Username of submitter |
| score | INTEGER | Story score |
| time | INTEGER | Unix time |
| time_ts | TIMESTAMP | Human readable time in UTC (format: YYYY-MM-DD hh:mm:ss) |
| title | STRING | Story title |
| url | STRING | Story url |
| text | STRING | Story text |
| deleted | BOOLEAN | Is deleted? |
| dead | BOOLEAN | Is dead? |
| descendants | INTEGER | Number of story descendants |
| author | STRING | Username of author |
Here are some sample rows (for readability purposes not all columns are selected):
| id | by | time_ts | title |
|---|---|---|---|
| 7405411 | ferhack | 2014-03-15 17:55:02 UTC | Hacker |
| 7541990 | jeassonlens | 2014-04-06 18:29:21 UTC | Marc Cormier, Real Estate Marketing Specialist |
| 7163174 | aryekellman01 | 2014-02-01 20:10:58 UTC | Accents from Around The World |
| 6807522 | wearefivek | 2013-11-27 11:14:52 UTC | Developer For Small, Creative Digital Design Studio |
| 6950020 | zeiny | 2013-12-22 11:23:41 UTC | Psychotropic drug use among people with dementia – a six-month follow-up study |
Prepare Logstash Configuration
First, follow the instructions on installing Logstash. Then, take a brief look at this full logstash configuration script. I’ll explain the details further down. The script can be downloaded here.
input {
  file {
    path => "/home/zenitk/hackernews.csv"
    start_position => "beginning"
    sincedb_path => "/dev/null"
  }
}

filter {

    csv {
        columns => [
            "id","by","score","time","time_ts","title",
            "url","text","deleted","dead","descendants","author"
        ]
        separator => ","
        skip_header => true
    }

    date {
        match => ["time_ts", "yyyy-MM-dd HH:mm:ss z"]
        target => "post_date"
        remove_field => "time_ts"
    }

    mutate {
        rename => {
            "dead" => "is_dead"
            "id" => "[@metadata][id]"
        }

        convert => {
            "is_dead" => "boolean"
        }

        remove_field => [
            "@timestamp",
            "host",
            "message",
            "@version",
            "path",
            "descendants",
            "time"
            "id"
        ]
    }
}

output {

  elasticsearch {
      hosts => ["localhost:9200"]
      index => "hackernews_import"
      document_id => "%{[@metadata][id]}"
  }

  stdout {}
}
As expected, each logstash configuration file is defined with the three main elements: input, filter, and output. More information can be found here in the documentation.
Input
input {
  file {
    path => "/home/zenitk/hackernews.csv"
    start_position => "beginning"
    sincedb_path => "/dev/null"
  }
}
Here we define that we want to have a file on the local machine as the source. At this point, this could be any text file, logstash doesn’t care. In the example above, we basically say that when it runs it should read from the beginning.
path - the absolute path on your machine
start_position - either beggining or end
sincedb_path - basically the location where logstash stores how far it read, so that when it’s started next time it can simply start where it stopped the last time
Warning: if you’re on Windows the path separator in path has to be /, but sincedb_path \. If you know why let me know!
More information on the file plugin here in the official documentation.
Filter
filter {

    csv {
        columns => [
            "id","by","score","time","time_ts","title",
            "url","text","deleted","dead","descendants","author"
            ]
        separator => ","
        skip_header => true
    }

    date {
        match => ["time_ts", "yyyy-MM-dd HH:mm:ss z"]
        target => "post_date"
        remove_field => "time_ts"
    }

    mutate {
        rename => {
            "dead" => "is_dead"
            "id" => "[@metadata][id]"
        }

        convert => {
            "is_dead" => "boolean"
        }

        remove_field => [
            "@timestamp",
            "host",
            "message",
            "@version",
            "path",
            "descendants",
            "time"
            "id"
        ]
    }
}
This section is optional if you want to just import the file and you don’t care how it shows up in elastic. But you should know here is the all the fun!
With the CSV plugin we tell logstash how our data is structured. We explicitly write all the column names and skip the header. Note that the filter itself supports auto detection of the column names based on the header. However, this requires some fiddling with the internal logstash configuration, specifically the the pipeline.workers has to be set to 1.
The time_ts field is basically just a string, so in the date plugin we tell logstash that it’s actually a date with the specified format. Then, we tell it to save it to the new target field, and to remove the old one. This way Elasticsearch recognizes it as an actual date.
Mutate
Now, the mutate plugin is where it gets juicy! ![]()
Here, we’re renaming dead to is_dead, because it’s common courtesy to name your booleans clearly.
Then, we rename id to [@metadata][id] because we don’t want the id to be saved like a normal field in Elasticsearch, since we would like to use it as an actual document id. What we actually do here is store the id into a temporary variable that is not being passed on in the end output. We use this variable later in the Output section. See the Metadata blog at Elastic for more information.
Similar to the date field, in convert we need to tell logstash that the string “true” is actually a boolean. No magic happens on its own.
Since Logstash was primarily designed, well, for logging, it stores a bunch of fields to Elasticsearch like “@timestamp”, “host”, “message”, “@version”, “path” that we don’t care about so with the remove_field configuration option. Additionaly, we get rid of fields from our CSV that are just taking space.
Output
output {

  elasticsearch {
      hosts => ["localhost:9200"]
      index => "hackernews_import"
      document_id => "%{[@metadata][id]}"
      #cacert => "/home/hackerman/elastic.cer"
      #user => "hackerman"
      #password => "блинчикиandpancakesandcrepes"
  }

  stdout {}
}
We output the data both into the standard output (for debugging purposes) and Elasticsearch.
Now in the elasticsearch section we say with document_id that we want to use our metadata field. With the %{ ... } syntax we just reference a variable.
If you have a custom certificate on your cluster and/or need credentials the commented section has the keywords you’ll need to access your cluster.
Run Logstash
Now that we finally have our logstash configuration file we can finally run it.
./logstash -f /home/zenitk/import-hackernews.conf
If everything runs smoothly (disclaimer: usually it doesn’t) you should see something like this:
. . .

{
    "post_date" => 2015-08-11T14:58:21.000Z,
       "author" => "Datafloq",
        "score" => "1",
           "by" => "Datafloq",
         "text" => nil,
      "is_dead" => true,
      "deleted" => nil,
         "time" => "1439305101",
        "title" => "5 Reasons Why Small Businesses Need Not Be Shy of Big Data",
          "url" => "https://datafloq.com/read/5-reasons-small-businesses-need-not-shy-big-data/1390"
}

. . .
Now we can do a check in Kibana:
# check the data types
GET hackernews_import/_mapping

# check if all the rows are imported
GET hackernews_import/_count
Note that I didn’t create the index first, but rather let Elasticsearch dynamically define the fields. This is fine for testing purposes or when just trying out the logstash script, but for production, you should strongly consider creating the index first with a dynamic mapping set to strict. This is however a topic on its own.
Often with CSVs that contain a lot of text, there will be trouble with parsing. If you had a stdout output it will usually show you when and where it failed (although cryptically sometimes). These rows can be corrected and simply placed at the end of the file while running Logstash.
Summary
Now we went through the whole process of importing CSV data into Elasticsearch.
Logstash can feel fiddly in the beginning, but once you get familiar with its quirks it can be a potent and easy tool for quick imports. I hope that after going through this blog you feel well armed to tackle some imports on your own. For instance, how about importing a JSON document? Or from a DB? I’m assured you’ll know where to start.
Please hit the comment section if you have some questions or feedback!
Other sources
If you’re more of a video person, here is a similar (but a bit older) tutorial:
Comments